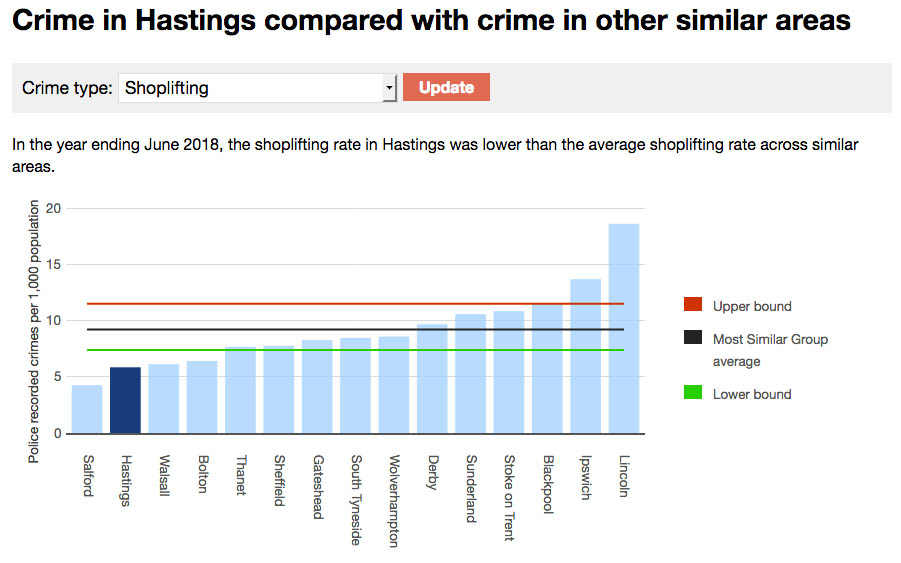
In the year ending June 2018, the shoplifting rate in Hastings was lower than the average shoplifting rate across similar areas.
The red and green lines show how far the shoplifting rate would normally vary from the average. Hastings lies below the green line, so its shoplifting rate is lower than normal for the group.
How to interpret this chart
This chart compares the crime rate in your local area to the average crime rate across similar areas. It shows the total number of crimes over a twelve month period per thousand residents, for the crime type selected.
Where your area lies in relation to the red and green lines is more important than its rank among similar areas. If your area lies between the red and green lines, its crime rate is normal for the group. If your area lies above the red line, its crime rate is higher than normal for the group, and similarly, if your area lies below the green line, its crime rate is lower than normal.